Unabashed Nostalgia and Technical Analysis
I’ve worked for a few companies over the years (go to my LinkedIn profile for the full gory details) - one of the most fun jobs was with Synergy Real-time Systems (don’t bother looking for it - it’s long gone) in London. The office was in the square mile of the City of London (the financial district), a stone’s throw from the Bank of England. Our core product (ok - our only product :-) ) was RITA - Real-time Interactive Technical Analysis. Technical Analysis is the practice of making investment decisions based on charts of stock prices. As well as the basic price, technical analysts look at other indicators such as moving averages and more complex analyses such as relative strength index and Bollinger bands. Anyway. I was playing with Google Desktop the other night and discovered its timeline. If you value your time, stay away! I spent a happy couple of hours googling through documents from 10 years ago. One that I found was a Word document I had emailed to my home account as a test. The document contained a RITA chart as an OCX control (OCX became ActiveX): 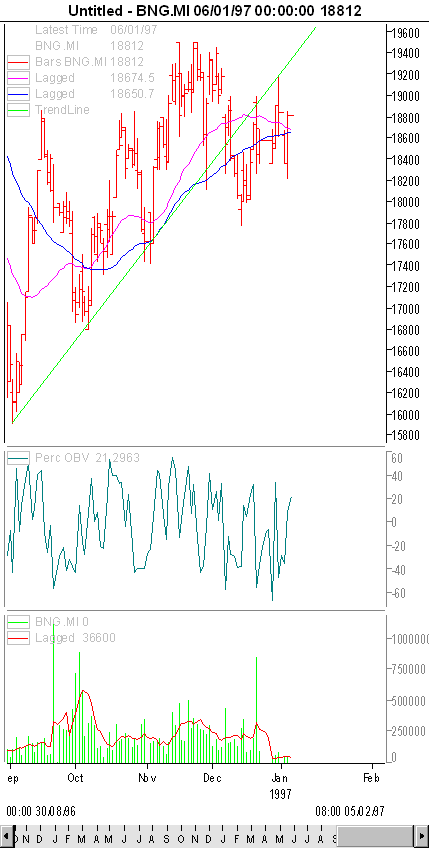 The chart shows the movement of the Benetton Group’s (BNG) stock on the Milan (.MI) market for the last 4 months in 1996. The top chart is a bar chart - each red vertical line shows the high (top of the line), low (bottom of the line), open (tick on the left) and close (tick on the right) for a given time period - in this case, each day. Superimposed on the bar chart are two moving averages and a trend line. The middle chart is percentage on-balance-volume (OBV), an indicator of momentum. The bottom chart shows volume bars (green) and a moving average of the volume. Don’t ask me whether the chart indicates a buy or a sell - I never could figure it out! What I did love was programming graphics. It’s very rewarding working on a system where the feedback is so immediate and visual. And working in a small company of less than 10 people - hi Ezra, Dilnaz, Mike, Matt, Chris, John, Dom, Kevin and Mike (Jenko!) (I’m sure I must have missed somebody!). And being able to go to the pick of the City’s pubs after work. Ah - happy days!
Comments
Rohan Pinto
Extremely iInteresting Pat,<p>You’d be surprised to hear that I too “had” worked on something similar around 6 years ago. I did something similar for a company called “optionwealth” which again is long gone… <p>I had built a web application that used a tool called crystal-ball that was a product sold by a company called “decisioneering” which is basicaly a MSFT excel plugin. (What I had built sounds similar to what you were working on, and thought of sharing the info too.. maybe someday we could build somethin similar again.)<p>The webapp (ie: a java wrapper around excel) would enable users to forecast (of the vested option) how many “options” to hold and how many to “sell” in otdet to attain a set target $$$ amount (in 365+1 days) based on historical values and also a personal estimate. One also had the ability to get various amout/date combinations based on a percentage of confidence of ones own estimate vs confidence on the historical values… (I had built a nice java slider module for that too…)<p>interetsing aye… how folks work on projects that are so similar and have absolutley no idea that others may have worked on it too unless the topic of discussion is shared…<p>This “blogdom” surely is opening up new innovative communication channels…
Leave a Comment
Your email address will not be published. Required fields are marked *